A sense of urgency
Our current financial situation
We are working hard to put our health system on more stable financial footing after three very difficult years. To do so, we’re focused on implementing solutions that are within our control and advocating for the partnerships necessary to achieve those we can’t on our own. While our work is driving progress in certain areas, we continue to feel the pressures of the many challenges we still face. Many of these obstacles predate the pandemic and impact rural health systems across the country.

Extreme inflation that has far surpassed our projections.

An aging and growing population that requires more care on average.

Workforce shortages have increased our reliance on costly temporary staff, while limiting capacity across our region’s health system.

Insufficient beds in care facilities outside of hospital settings. The lack of space in more appropriate care settings (i.e. skilled nursing facilities) is leading to patients staying longer in hospitals than they need to, which typically costs more.
Our budgets for fiscal year 2024 paint a realistic picture of what is needed to care for our patients today and move us toward financial sustainability—an outlook shared by several of the world’s largest credit rating agencies including Moody’s Investors Service, S&P Global Ratings and Fitch Ratings.
Despite our recent financial challenges, these agencies maintain high confidence in our organization and our long-term strategy. Nevertheless, they recognize that more work needs to be done to improve our situation and achieve a modest margin. This will allow us to meet our region’s health care demands by investing in our people and technology as well as facilities maintenance, repair and improvements.
Extreme health care cost inflation continues to pose serious challenges to our financial and operational sustainability. Each year, we work to cover the cost of inflation in our budget process, but we have not been able to keep pace with the inflationary pressures of the past two years, which far surpassed our projections and the rate increases approved by our regulators.
Our budget this year projects cost inflation of $105 million.
In addition, we absorbed a further $89.6 million in cost inflation—tied to 2022 and 2023—by limiting our spending and tapping into our financial reserves. This isn’t sustainable in the long-term because it limits our ability to prepare for unexpected emergencies—such as the 2020 cyberattack on our health system or the COVID-19 pandemic—or make needed investments in our people, technology and facilities that directly impact the care we can provide to our patients.
The high rate of health care inflation has dramatically increased the cost to care for our patients in the past two years.
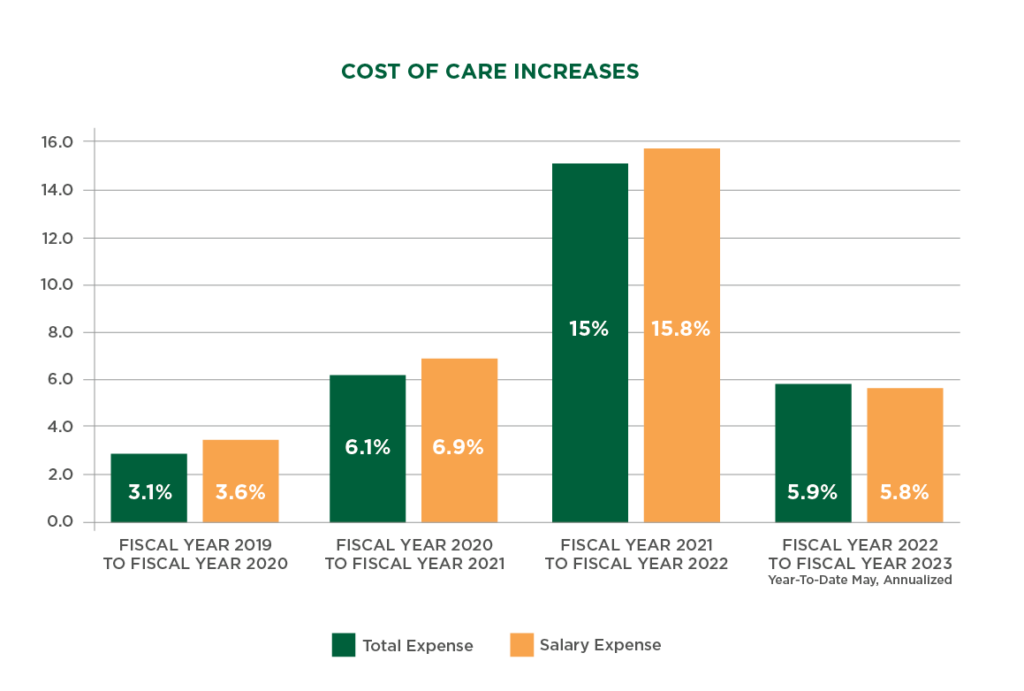
Across the country and our region, there are not enough qualified nurses, doctors, and other health care staff to hire. This creates a workforce shortage at all levels of patient care and adds pressure on our teams. To fill the need, health care organizations everywhere have contracted with temporary health care staff, known as travelers.
The cost increases we’re experiencing are largely due to the high demand for traveler staff across the country, which has resulted in unprecedented hiring costs, as seen below.
By the numbers: traveler costs
The rate we paid to traveler staff in 2019.
The rate paid to traveler staff at its peak in 2022—a 116% increase from 2019.
Traveler rate budgeted for 2024.
The number of full-time (FTE) travelers employed by the UVM Health Network in 2019.
The number of traveler FTE at its peak in 2023—a 337% increase from 2019.
Traveler FTE budgeted for 2024. This represents a reduction in our reliance on travelers and indicates the staff we need to provide care.
Our workforce efforts and national trends in health care labor are reducing these costs. As we continue to see high demand for care across our health system, our ongoing recruitment and retention efforts—including professional development programs , salary increases, retention payments, housing support and engagement initiatives—are reducing our reliance on travelers and decreasing associated costs. Where appropriate, we’re adding more hybrid and remote work opportunities, and we’re scaling up professional development programs for much-needed patient facing roles.
Since October 2022, traveler expenses have declined by $2.9M per month.
Due to the widespread labor shortages and insufficient beds across the region’s health system, we are unable to transfer patients as quickly to more appropriate, lower-cost settings—such as skilled nursing or mental health facilities—when they no longer need care in our hospitals. Even when no beds are available in these settings, we continue to provide care to these patients, even though certain health insurance requirements often mean we are not reimbursed for this care.
One of our priorities is reducing our patients’ time in hospital settings and transitioning them to a more appropriate point of care as soon as they are ready. This enables more of our patients to get the care they need closer to home, while lowering costs of care across our health system. As more beds become available in skilled nursing and mental health facilities across the region, our efforts to reduce our patients’ length of stay will accelerate.
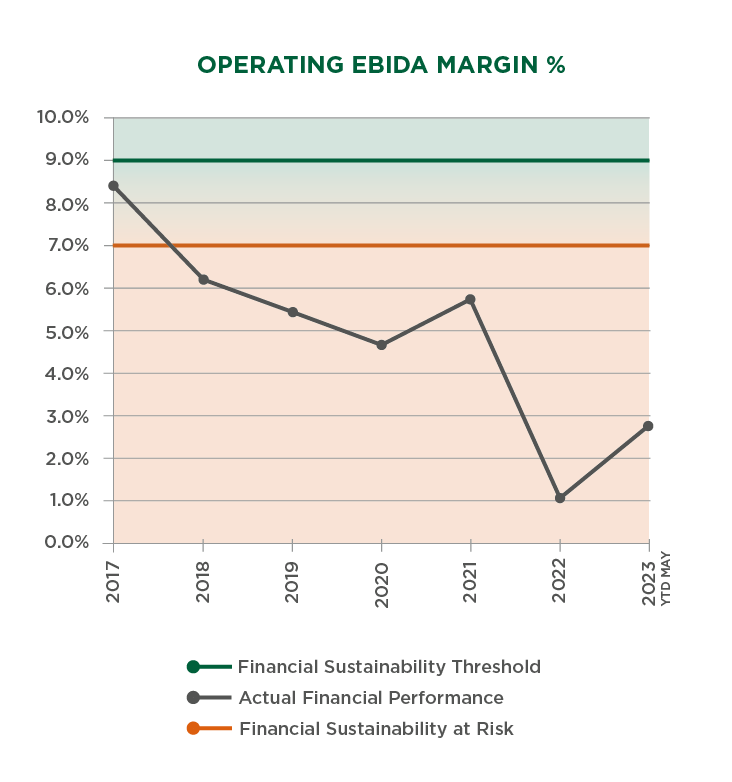
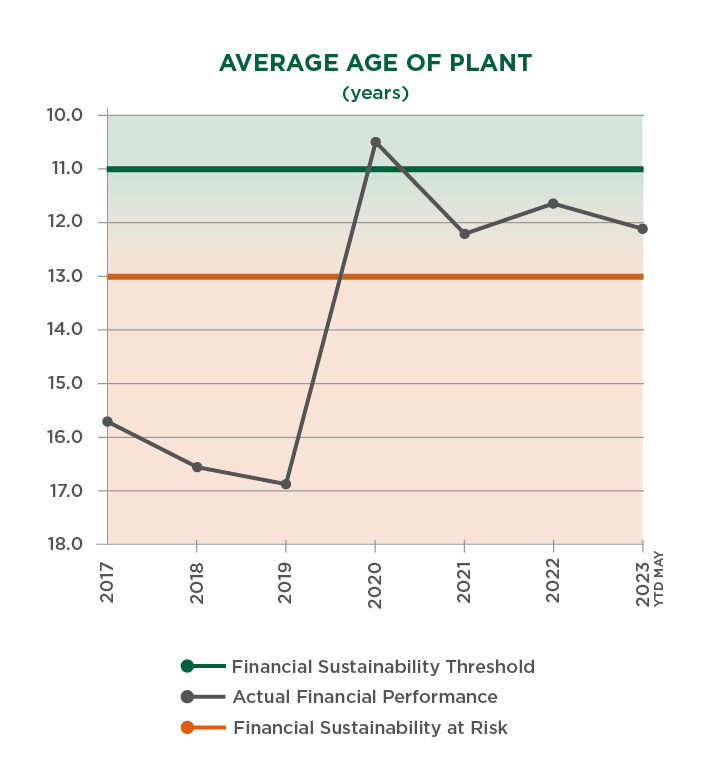
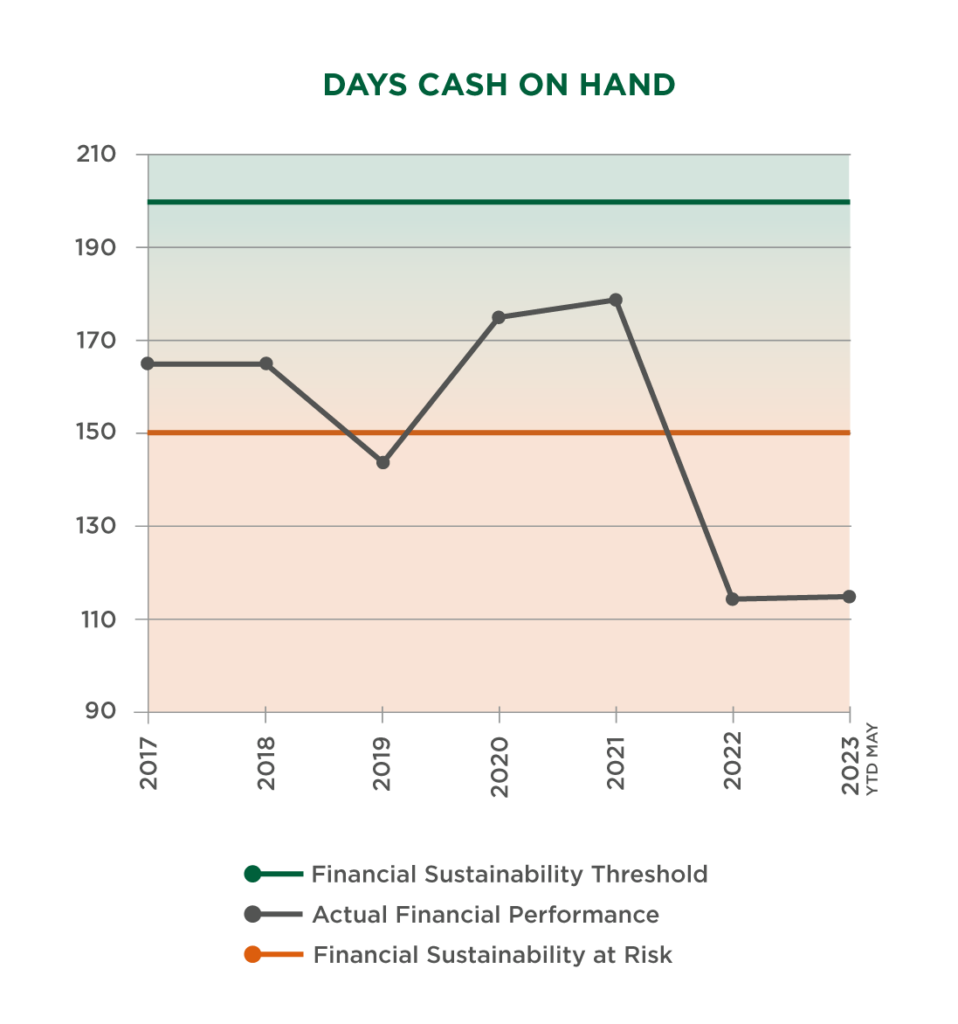
The following graphs illustrate the negative effects these circumstances have had across the Network, with the financial condition of our Vermont hospitals illustrating the seriousness of the situation.
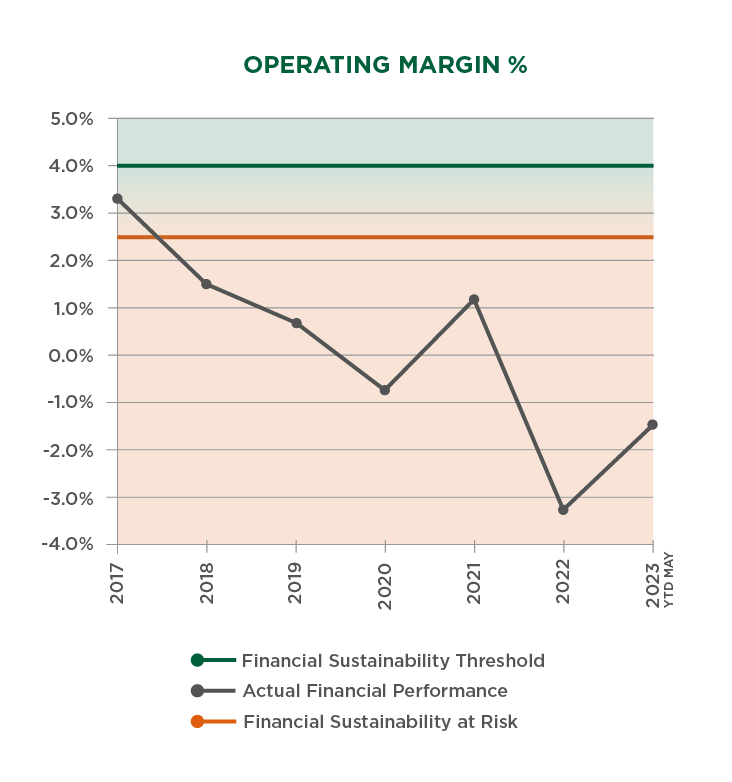

More rural health care facilities have already closed in 2023 than the previous two years combined.

In Vermont, more than 75% of hospitals have negative operating margins. Only four other states across the country have this many hospitals working with negative margins.

The majority of the country’s nonprofit hospitals continue to lose money.

More than 150 rural hospitals have shut down or closed their inpatient care services since 2010, including 9 hospitals in New York and New England.

In New York, four out of every five hospitals have negative or unsustainable operating margins.